 MarkIOY阅读中文
Image to Markdown
A photographed page, whiteboard, or handwritten note is useful only when you can work with it. MarkIOY Web turns supported images into editable Markdown, so the text can return to a normal document workflow.
What Image to Markdown does
Image to Markdown reads the visible structure of a page and returns a Markdown draft. It is useful for typed printouts, handwritten notes, meeting boards, worksheets, tables, and notes containing equations. The return value is ordinary Markdown: you can edit it in source view, preview it visually, and download the .md file.
PDF to Markdown
Signed-in Web users can also choose a PDF and select up to 10 pages. MarkIOY reads the PDF locally: simple text pages stay on the device, while selected complex pages are rendered locally for recognition. The original PDF is never uploaded. Review every page before inserting its Markdown, especially formulas, tables, columns, and charts.
The result is a starting document, not a scan preserved as text. It may recognize a title as # Heading, a numbered list as Markdown list items, a formula as LaTex between $$ delimiters, and columns as a Markdown table. It does not know the author’s intent when a character is ambiguous.
Who can use it and which files work
Sign in to MarkIOY Web, then choose Image to Markdown from the editing toolbar. The web feature accepts JPEG, PNG, GIF, and WebP images up to 7.5 MB. Use a single image at a time; after the conversion completes, the new Markdown replaces the current editor content, so download a document you want to keep first.
| Good source | Usually recognized well | Needs closer review |
|---|---|---|
| A straight, well-lit page | Headings, paragraphs, ordinary lists | Faint pencil, shadows, decorative lettering |
| Clear equations and column rules | Simple formulas and tables | Subscripts, superscripts, merged cells, tiny labels |
| A chart with labels and values | Text, axes, values, and captions | The visual chart structure; rebuild it as Mermaid or a table |
Prepare an image for a reliable result
Place the page flat, crop away unrelated surroundings, and keep the text upright. Even lighting and a sharp focus matter more than a very large file. For handwriting, use dark ink with enough space between lines. If a page has a table or formula, include its full border and all of its symbols in the crop.
After conversion, read the Markdown from top to bottom. On a multi-column page, MarkIOY keeps each left-hand column together before moving to the right-hand column, rather than interleaving lines. Text written in a clearly different color becomes a nearby quoted annotation, while ordinary colored headings and cells remain normal content. Check names, dates, units, minus signs, decimal points, and math delimiters. A table can look almost correct while one column has shifted; a formula can look correct while a single exponent is missing.
A real handwritten-note conversion
This example uses the Image to Markdown service on the handwritten page below. The page intentionally contains prose, callouts, equations, a table, and a small line chart. The source image and the returned Markdown are shown without manually correcting the conversion.
The source image
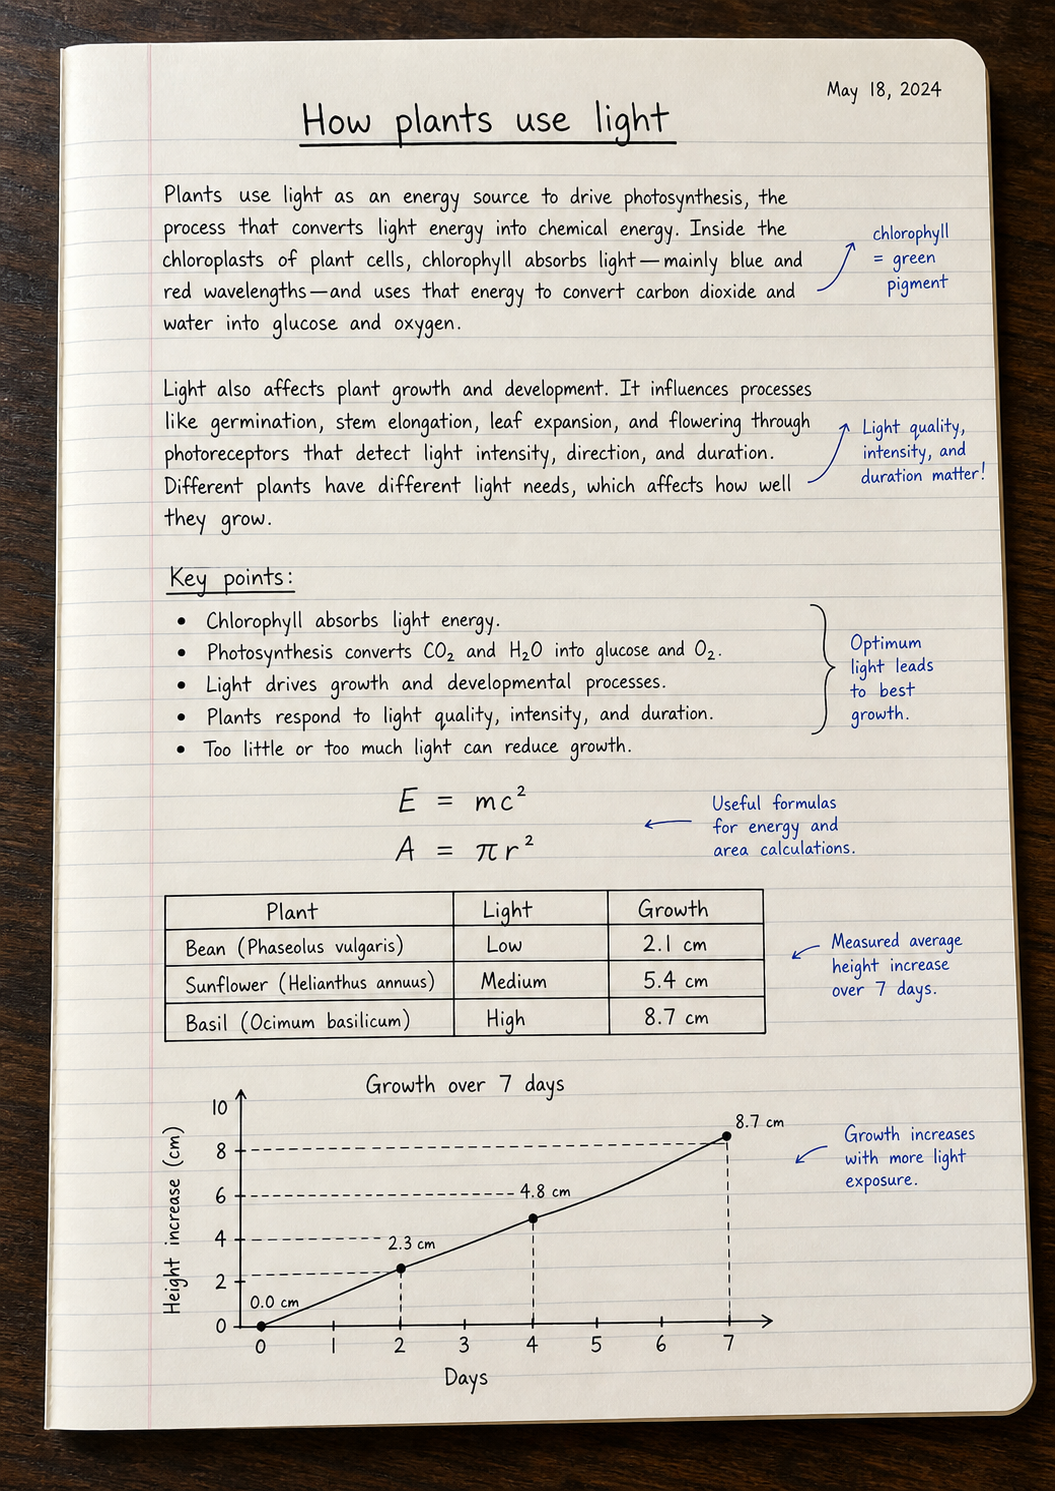
The handwriting is clear but intentionally natural: heading weights vary, notes sit in the margin, and the chart is drawn rather than encoded as data.
The Markdown returned by the service
May 18, 2024

# How plants use light

Plants use light as an energy source to drive photosynthesis, the process that converts light energy into chemical energy. Inside the chloroplasts of plant cells, chlorophyll absorbs light—mainly blue and red wavelengths—and uses that energy to convert carbon dioxide and water into glucose and oxygen.
> chlorophyll = green pigment

Light also affects plant growth and development. It influences processes like germination, stem elongation, leaf expansion, and flowering through photoreceptors that detect light intensity, direction, and duration. Different plants have different light needs, which affects how well they grow.
> Light quality, intensity, and duration matter!

## Key points:

* Chlorophyll absorbs light energy.
* Photosynthesis converts CO₂ and H₂O into glucose and O₂.
* Light drives growth and developmental processes.
* Plants respond to light quality, intensity, and duration.
* Too little or too much light can reduce growth.

> Optimum light leads to best growth.

$$E = mc^2$$
$$A = \pi r^2$$

> Useful formulas for energy and area calculations.

| Plant | Light | Growth |
| :--- | :--- | :--- |
| Bean (*Phaseolus vulgaris*) | Low | 2.1 cm |
| Sunflower (*Helianthus annuus*) | Medium | 5.4 cm |
| Basil (*Ocimum basilicum*) | High | 8.7 cm |

> Measured average height increase over 7 days.

### Growth over 7 days

Height increase (cm)
10
8
6
4
2
0
0.0 cm
2.3 cm
4.8 cm
8.7 cm
0 1 2 3 4 5 6 7
Days

> Growth increases with more light exposure.
Rendered result
May 18, 2024
How plants use light
Plants use light as an energy source to drive photosynthesis, the process that converts light energy into chemical energy. Inside the chloroplasts of plant cells, chlorophyll absorbs light—mainly blue and red wavelengths—and uses that energy to convert carbon dioxide and water into glucose and oxygen.
chlorophyll = green pigment
Light also affects plant growth and development. It influences processes like germination, stem elongation, leaf expansion, and flowering through photoreceptors that detect light intensity, direction, and duration. Different plants have different light needs, which affects how well they grow.
Light quality, intensity, and duration matter!
Key points:
- Chlorophyll absorbs light energy.
- Photosynthesis converts CO₂ and H₂O into glucose and O₂.
- Light drives growth and developmental processes.
- Plants respond to light quality, intensity, and duration.
- Too little or too much light can reduce growth.
Optimum light leads to best growth.
Useful formulas for energy and area calculations.
| Plant | Light | Growth |
|---|---|---|
| Bean (Phaseolus vulgaris) | Low | 2.1 cm |
| Sunflower (Helianthus annuus) | Medium | 5.4 cm |
| Basil (Ocimum basilicum) | High | 8.7 cm |
Measured average height increase over 7 days.
Growth over 7 days
Height increase (cm): 0.0, 2.3, 4.8, 8.7 · Days: 0, 1, 2, 3, 4, 5, 6, 7
Growth increases with more light exposure.
This conversion correctly captured the prose, the two display formulas, the Markdown table, and most annotations. The line chart became readable labels and values rather than a Mermaid chart. That is useful source material, but it should be reorganized into a table or a Mermaid diagram if the chart itself matters.
What to review before publishing
Review every conversion, especially anything that changes a meaning or a measurement. Compare mathematical operators character by character; verify table headers against their columns; and turn chart data into an explicit structure. When a visual chart cannot be safely reconstructed, MarkIOY crops that region from the original image and inserts it as an inline PNG, so the exported Markdown still works offline. This preserves the visual, but increases the Markdown file size. For this example, a small Markdown table of days and height would make the data reusable, while a Mermaid xychart or a manually drawn chart would restore the visual relationship.
Use the original image as your reference. Image to Markdown helps you get to editable text quickly; it does not prove that the returned text is accurate. This is particularly important for medical, legal, financial, academic, and safety-related material.
A practical image-to-Markdown workflow
- Sign in and save any open work you do not want to replace.
- Choose a clear supported image from Image to Markdown.
- Wait for the Markdown draft, then read it beside the original image.
- Correct text, formulas, tables, and chart data in source view.
- Use visual preview to check reading order and rendered equations.
- Download the Markdown when it is ready to keep or share.
Privacy and permissions
The selected image is sent to the conversion service only to perform the requested conversion. Do not upload an image you do not have permission to process, and do not treat the feature as a substitute for your organization’s data-handling policy. Remove sensitive information from the image whenever practical, then review the returned Markdown before distributing it.
Turn a page into an editable document
Sign in to MarkIOY Web, choose an image, and refine the returned Markdown in the editor.
Open MarkIOY Web →